
DevOps Practices for Azure Infrastructure - Continuous Operations & Continuous Monitoring
This series on implementing DevOps practices for Azure infrastructure is nearing its conclusion. The last part remaining is completing the operations side of the loop.

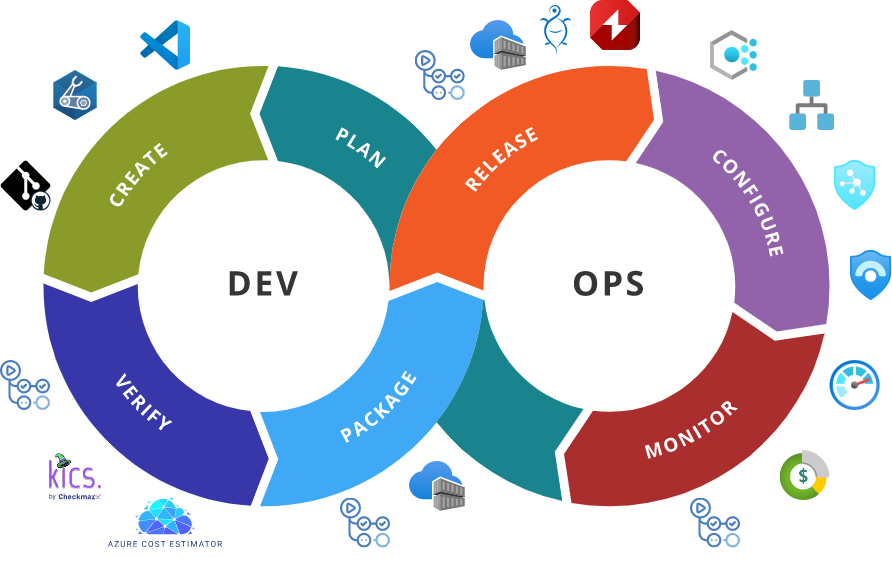
This brings focus to the last two practices on our list:
- Continuous Planning
- Continuous Integration
- Continuous Delivery
- Continuous Deployment
- Continuous Testing
- Continuous Operations
- Continuous Monitoring
Continuous Operations & Continuous Monitoring
The Continuous Operations and Continuous Monitoring practices are closely tied together. They jointly serve the goal of ensuring the overall reliability, resiliency, and security of solutions. The majority of capabilities supporting that goal are within the scope of Continuous Operations practice and cover aspects like compliance enforcement, cost management, proactive maintenance, security posture management, and intelligence-driven responses to operational and security events. That said, most of those capabilities can't be achieved without capabilities coming from Continuous Monitoring practice. There can be no cost management without cost tracking. There is no way to have proactive maintenance and intelligence-driven responses without gathering observability signals, configuring alerts, and building dashboards.
Organizations usually have the capabilities covered by Continuous Operations and Continuous Monitoring already established, but often they are not aligned with DevOps cultural philosophies. This means that implementing those practices is often about addressing gaps around automation, collaboration, continuous feedback, and continuous improvement.
But before we start addressing those gaps, it's worth making sure that the capabilities have been established on the right foundations, as Azure provides a wide range of services to support us here:
- Azure Policy for compliance enforcement.
- Azure Monitor with its insights, visualization, analytics, and response stack for gathering observability signals, configuring alerts, and building dashboards.
- Microsoft Defender for Cloud for workload protection and security posture management.
- Azure Sentinel for security information and event management (SIEM) as well as security orchestration, automation, and response (SOAR).
- Azure Automation and Azure Logic Apps for automating event-based intelligence-driven responses and orchestrating proactive maintenance.
- Microsoft Cost Management and Billing for cost tracking and management.
With the right foundations in place, we can focus on aspects that make the difference between "being DevOps" and "not being DevOps". The most crucial one is ensuring that everyone has access to information on how the part they are responsible for is behaving in production.
All Teams Need Observability Signals
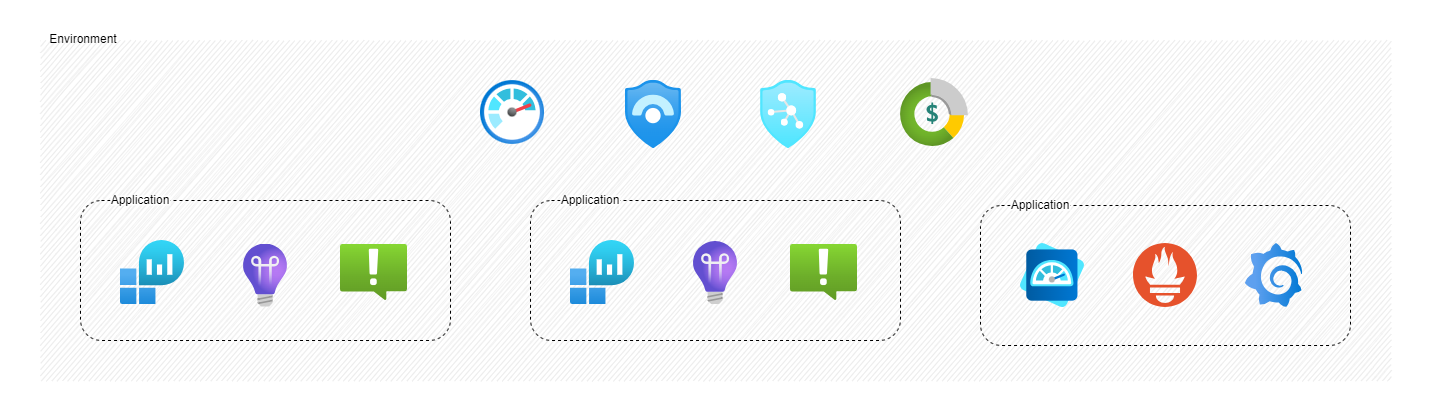
As you may remember from the post on Continuous Delivery and Continuous Deployment, at certain sizes solutions often start moving from centralized ownership to being owned by multiple independent applications teams and an environment team. This dynamics needs to be reflected in monitoring architecture as well. A single, centralized monitoring service, although needed by the environment team, may not be sufficient. This is why mature monitoring implementations utilize resource-context observability signals and granular insights, visualization, and analytics workspaces from which the signals are later centrally aggregated. This approach enables every application team to have direct access to its signals, configure alerts and build dashboards, while the environment team still has visibility into the whole picture.
This approach also enables democratization when it comes to the tools itself. The native observability stack in Azure is provided by Azure Monitor, but it no longer means that application teams are fully limited to Application Insights. If they prefer they can use Prometheus and Grafana for metrics (which is great when they need to be more cloud agnostic and looking at adopting Open Telemetry).
Of course, such a democratized monitoring architecture cannot be left without governance. There need to be rules around observability signals granularity, retention, and archiving data to cool-tier storage. Otherwise, we can be very unpleasantly surprised by the cost of our monitoring implementation.
Automated responses should also be exporting proper context information to the respective tools - because part of automated response should be creating a proper item in the collaboration tool to ensure continuous feedback. What item should that be? That depends on the event category.
Operational Events Should Create Issues
From the infrastructure perspective, there are usually two main types of operational events that are potentially interesting:
- Resources events like creation, deletion, or modification
- Alerts defined in Azure Monitor
The usage of resource events often covers adding special tags, granting permissions to special groups, or reacting to delete/create/update operation fails.
Alerts are usually raised when the measured state of the system deviates from what is considered a baseline. To name just a few examples, this can mean networking issues, an erroneously stopped VM, or a resource reaching its capacity.
The remediation for every resource event or alert can be different. In some cases, the remediation can be fully automated (restarting a VM, truncating tables in a database, or increasing RUs for Azure Cosmos DB). In some cases, all that is needed is just a notification to deal with the problem at the earliest convenience (failure to delete a resource). There are also those cases that require waking up an engineer immediately (networking issues).
In the first post of this series, I wrote that the cornerstone of implementing DevOps practices for Azure infrastructure is infrastructure as code and the Git ecosystem used for collaboration. This means that regardless if the remediation is fully automated or an engineer needs to be engaged, part of the process should be issue creation (if the remediation has been already performed that issue can be closed and exist just for tracking purposes). In the stack I've chosen for this series, the Git ecosystem is GitHub. Integrating GitHub issue creation into the response workflow is not a huge challenge, because there is a ready-to-use GitHub connector for Azure Logic Apps. So, if we consider alerts, this means that we can build an automated response flow by using Azure Monitor Alerts, Azure Monitor Action Group, and Azure Logic Apps.
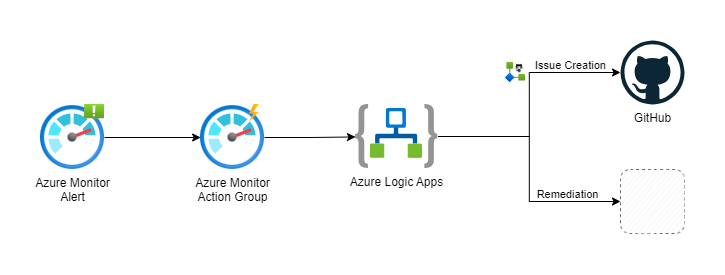
Almost identical flow can be built for the resources events if we use Azure Event Grid in place of Azure Monitor (as Azure Event Grid supports resource groups and subscriptions as sources).
This is the approach that should be applied to ensure collaboration and continuous feedback when it comes to operational events, how about security events?
Security Events Should Create Vulnerabilities
Security events have a specific lifecycle that falls under the responsibility of the organization's Security Operations Center (SOC). It's the SOC that uses available observability signals, CVE alerting platforms like OpenCVE, and other tools to detect, investigate, and remediate threats. In the case of Azure, Azure Sentinel is the one-stop shop to build and automate this responsibility.
That said, SOC usually deals with the immediate remediation of a threat. For example, SOC operator or automation may determine that to mitigate a threat a specific resource needs to be isolated because a new CVE has been disclosed. The only action performed will be isolation - the responsibility for mitigating the CVE is with the application or environment team. In such cases, the SOC operator or automation should report the specific vulnerability with context and findings in the collaboration tool. When using GitHub as the Git ecosystem for collaboration, a great way to report such vulnerabilities may be through security advisories.
Security advisories facilitate the process of reporting, discussing, and fixing vulnerabilities. Creating security advisories requires admin or security manager role within the repository, so the integration must be designed properly to avoid excessive permissions within the organization. My approach is to create a GitHub App. GitHub Apps use OAuth 2.0 and can act on behalf of a user, which in this case will be SOC operator or automation. To make the creation of security advisories available directly from Azure Sentinel, I expose a webhook from the GitHub App which can be called by a Playbook.

Providing automated tools which don't require context switching from the SOC perspective removes roadblocks, which is crucial for the adoption of collaboration and continuous feedback between otherwise disconnected teams. This is the true spirit of DevOps.
Infrastructure Drift Detection
There is one capability in the context of Continuous Monitoring and Continuous Operations, which is very specific to infrastructure - detecting drift.
As I have shown through the series, if we want to implement DevOps practices for Azure infrastructure, the infrastructure should be changed only through modifying and deploying its code. The repository should be the single source of truth. But sometimes, when there is pressure, stress, or time constraints (for example when solving a critical issue) engineers do take shortcuts and modify the infrastructure directly. It's not that big of an issue if such an engineer will later reflect the changes in the infrastructure code. But humans are humans and they sometimes forget. This can cause the environment to drift from its source of truth and creates potential risks from applied change being reverted after the deployment to deployment failures. This is why detecting drift is important.
Infrastructure drift detection is a complex problem. Depending on chosen stack there are different tools you can use to make it as sophisticated as you need. Here, as an example, I'm going to show a mechanism that can be set up quickly based on the stack I've already used throughout this series. It's far from perfect, but it's a good start. It's using the what-if command, which I've already been using for creating previews of changes as part of Continuous Integration implementation.
az deployment group what-if \
    --resource-group rg-devops-practices-sample-application-prod \
    --template-file applications/sample-application/application.bicep \
    --mode Complete \
    --no-pretty-print
You may notice two differences between the usage of what-if for previews and drift detection.
The first difference is the Complete deployment mode. The difference between Incremental (the default) and Complete deployment modes is that in the case of the second resources that exist in the resource group but aren't specified in the template will be deleted instead of ignored.
The second difference is the output format. For the previews, I wanted something human-readable, but here I prefer something which will be easy to process programmatically. Providing the --no-pretty-print switch changes the output format to JSON. Below you can see a snippet of it.
{
  "changes": [
    {
      "after": null,
      "before": {
        "name": "kvsampleapplication",
        ...
      },
      "changeType": "Delete",
      ...
    },
    {
      "after": {
        "name": "id-sampleapplication-gd3f7mnjwpuyu",
        ...
      },
      "before": {
        "name": "id-sampleapplication-gd3f7mnjwpuyu",
        ...
      },
      "changeType": "NoChange",
      ...
    },
    ...
  ],
  "error": null,
  "status": "Succeeded"
}
Our attention should focus on the changeType property. It provides information on what will happen with the resource after the deployment. The possible values are: Create, Delete, Ignore, NoChange, Modify, and Deploy. Create, Delete, and NoChange are self-explanatory. The Ignore value should not be present in the case of Complete deployment mode unless limits (number of nested templates or expanding time) have been reached - in such case, it will mean that the resource hasn't been evaluated. Modify and Deploy are tricky. They mean that the properties of the resource will be changed after the deployment. Unfortunately, the Resource Manager is not perfect here and those two can give false positive predictions. This is why this technique is far from perfect - the only drift that can be reliably detected are missing resources or resources which shouldn't exist. But, as I said, it's a good start as we can quickly create a GitHub Actions workflow that will be performing the detection. Let's start by checking out the deployed tag and connecting to Azure.
...

env:
  TAG: sample-application-v1.0.0

jobs:
  drift-detection:
    runs-on: ubuntu-latest
    permissions:
      id-token: write
      contents: read
    steps:
    - name: Checkout
      uses: actions/checkout@v3
      with:
        ref: ${{ env.TAG }}
    - name: Azure Login
      uses: azure/login@v1
      with:
        ...
  ...
The next step is to run a script that will call what-if and process the results to create an array of detected changes.
...

env:
  ...
  RESOURCE_GROUP: 'rg-devops-practices-sample-application-prod'

jobs:
  drift-detection:
    ...
    steps:
    ...
    - name: Detect infrastructure drift
      shell: pwsh
      run: |
        $issues = @()

        $drift = az deployment group what-if `
          --resource-group $env:RESOURCE_GROUP `
          --template-file applications/sample-application/application.bicep `
          --mode Complete `
          --no-pretty-print | ConvertFrom-Json

        foreach ($change in $drift.Changes)
        {
          switch ($change.changeType)
          {
            'Create'
            {
              $issues += @{
                ResourceName = $change.after.name
                Description = 'Defined resource doesn''t exist'
              }
            }
            'Delete'
            {
              $issues += @{
                ResourceName = $change.before.name
                Description = 'Undefined resource exists'
              }
            }
          }
        }

        'DRIFT_ISSUES<> $env:GITHUB_ENV
        $issues | ConvertTo-Json -AsArray >> $env:GITHUB_ENV
        'EOF' >> $env:GITHUB_ENV
  ...
Having all the changes gathered, we can use the proven script action to create an issue for every detected change.
...

jobs:
  drift-detection:
    ...
    permissions:
      ...
      issues: write
    steps:
    ...
    - name: Report detected infrastructure drift
      uses: actions/github-script@v6
      with:
        script: |
          const issues = JSON.parse(process.env.DRIFT_ISSUES);
          for (const issue of issues) {
            github.rest.issues.create({
              owner: context.repo.owner,
              repo: context.repo.repo,
              title: '[DRIFT DETECTED] ' + issue.Description + ' (' + issue.ResourceName + ')'
            });
          }
  ...
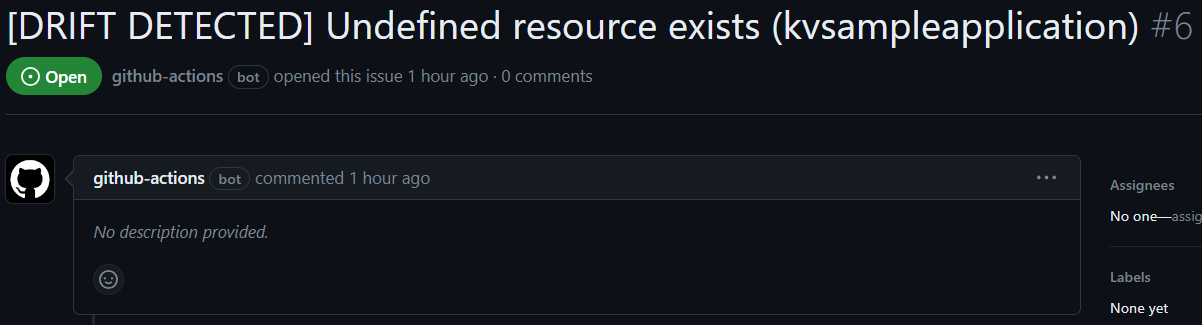
We can have this action running regularly. It will be creating nice issues like the one in the screenshot and will give us some start in drift detection.
The Journey Never Ends
With Continuous Operations and Continuous Monitoring practices, we have closed the loop.
But the nature of a loop is that an end is also the beginning. The implementation of DevOps is never "done". It's a direct consequence of its core cultural philosophies: continuous feedback and continuous improvement. Regardless of how your initial implementation will look, you should constantly evaluate it in the context of the ecosystem around and evolve. This will mean modifying the implementation of already established practices, but also implementing new complementary ones (like Continuous Learning or Continuous Documentation).
The goal of this series was to draw the overall picture and provide examples that will bring that picture to life. The accompanying repository contains working workflows that can kickstart your journey.