
DevOps Practices for Azure Infrastructure - Continuous Integration
The generally adopted definition of DevOps methodology says that it's a combination of cultural philosophies, practices, and tools that increases an organization’s ability to deliver solutions. That's very broad. So broad, that initial adoption in the case of many organizations has focused on applying it only to application code. This has led to the naming of several additional methodologies to either further blend DevOps with additional areas or focus on previously neglected aspects: DevSecOps, FinOps, DataOps, GitOps, or MLOps. But, regardless of the flavor, the core remains the same. This is why, although I'm writing about DevOps in the context of infrastructure, I have avoided using GitOps in the title.
If you look for a definition of GitOps, you may find statements like "GitOps is a process of automating IT infrastructure using infrastructure as code and software development best practices" or "GitOps is a subset of DevOps". In reality, the term has been strongly tied to a specific ecosystem and specific tools. I don't want to fight with those associations. Instead, I want to focus on the essence - applying DevOps practices to infrastructure.
DevOps Practices
DevOps practices are a way to bring DevOps cultural philosophies (collaboration, automation, continuous feedback, continuous improvement, etc.) to life. They are used to implement all the stages of the DevOps pipeline:

You may find slightly different lists of those practices, this is the one I prefer:
- Continuous Planning
- Continuous Integration
- Continuous Delivery
- Continuous Deployment
- Continuous Testing
- Continuous Operations
- Continuous Monitoring
In this post, I want to focus on Continuous Integration.
Continuous Integration Practice
On some occasions, I've heard an opinion that Continuous Integration is about merging the changes. The truth is that correctly implemented Continuous Integration practice covers the Create and Verify stages of the DevOps pipeline.
It shouldn't be a surprise that the cornerstone of the Create stage in the case of infrastructure is infrastructure as code, the tooling used for development, and the Git ecosystem used for collaboration. This is something that is already widely adopted with many options to choose from:
- Terraform, Bicep, or Pulumi just to name some popular infrastructure as code options.
- GitHub, Azure DevOps, or GitLab as potential Git ecosystems.
- VS Code, Neovim, or JetBrains Fleet as possible development environments.
The above list is in no way exhaustive. I also don't aim at discussing the superiority of one tool over another. That said, discussing the Verify stage, which is the more challenging part of Continuous Integration practice, will be better done with specific examples. This is why I must choose a stack and I'm going to choose Bicep (as I'm writing this in the context of Azure) and GitHub (because it has some nice features which will make my life easier).
So, once we have our infrastructure as code created, what should we consider as verification from the perspective of Continuous Integration? In the beginning, I quoted a statement saying that GitOps is about using software development best practices in the process of automating infrastructure. What would be the first thing one would do with an application code to verify it? Most likely build it.
Building and Linting for Infrastructure Code
Building or compiling application code is the first step of the Verify stage. In the software development context, it's sometimes thought of as a way to generate the binaries (and it is), but it's also verifying if the code is syntactically correct. In the context of IaC, it means checking for the correct use of language keywords and that resources are defined according to the requirements for their type. This is something that IaC tooling should always support out of the box. Bicep provides this capability through az bicep build command, which we can simply run as a step in a workflow.
...

jobs:
  build-and-lint:
    runs-on: ubuntu-latest
    steps:
    - name: Checkout
      uses: actions/checkout@v3
    - name: Build and lint Bicep
      run: |
        az bicep build --file applications/sample-application/application.bicep
  ...
The az bicep build command also performs a second activity, which is closely tied to building/compiling - it runs linter over the template. The goal of linting is to help enforce best practices and coding standards based on defined rules. Best practices and coding standards are something that sometimes needs to be tailored to a specific team and organization, this is why Bicep allows for the configuration of rules severity through the bicepconfig.json file. Possible options are Error, Warning, Info, and Off. By default, the majority of rules are set to either Warning or Off. The typical adjustment which I almost always do is bumping No unused parameters to Error and enabling Use recent API versions (as it is Off by default).
{
    "analyzers": {
        "core": {
            "enabled": true,
            "rules": {
                ...
                "no-unused-params": {
                    "level": "error"
                },
                ...
                "use-recent-api-versions": {
                     "level": "warning"
                },
            }
        }
    }
}
The bicepconfig.json file should be committed to the repository, which will ensure that the local development environment will pick up the same configuration. This includes VS Code (if the Bicep extension is installed), enabling immediate feedback for engineers (in the spirit of DevOps cultural philosophies). Of course, engineers can ignore that feedback or simply use tooling which doesn't provide it, but then the Build and lint Bicep step of the integration workflow will catch it and give them that feedback.

If everything is correct, the workflow should move to the next phase, which doesn't mean we should be done with looking at the code itself. Following the software development best practices, the next phase should be static analysis.
Static Analysis for Infrastructure Code
Application code is usually scanned with tools like SonarQube, Veracode, Snyk, or GitHub's own CodeQL to detect potential vulnerabilities or bad patterns. The same should be done for infrastructure code and there are ready-to-use tools for that like KICS or Checkov. They are both designed to detect security vulnerabilities, compliance issues, and misconfigurations in our IaC. They both come with a huge set of configurable rules and the capability to create your own.
I prefer KICS, especially the way it can be integrated with GitHub. Checkmarx, the company behind KICS, provides a ready-to-use action. The support for Bicep is "indirect" - KICS supports ARM so the analysis has to be done after the build step. There is also small preparation needed as the directory for output should be created. Still, adding KICS-based static analysis to the workflow is only about 10 lines.
...

jobs:
  build-lint-and-static-analysis:
    runs-on: ubuntu-latest
    steps:
    ...
    - name: Create static analysis results folder
      run: |
        mkdir -p static-analysis-results
    - name: Perform KICS static analysis
      id: kics
      uses: checkmarx/[email protected]
      with:
        path: 'applications/sample-application/'
        fail_on: 'high,medium'
        output_path: 'static-analysis-results'
        output_formats: 'json,sarif'
  ...
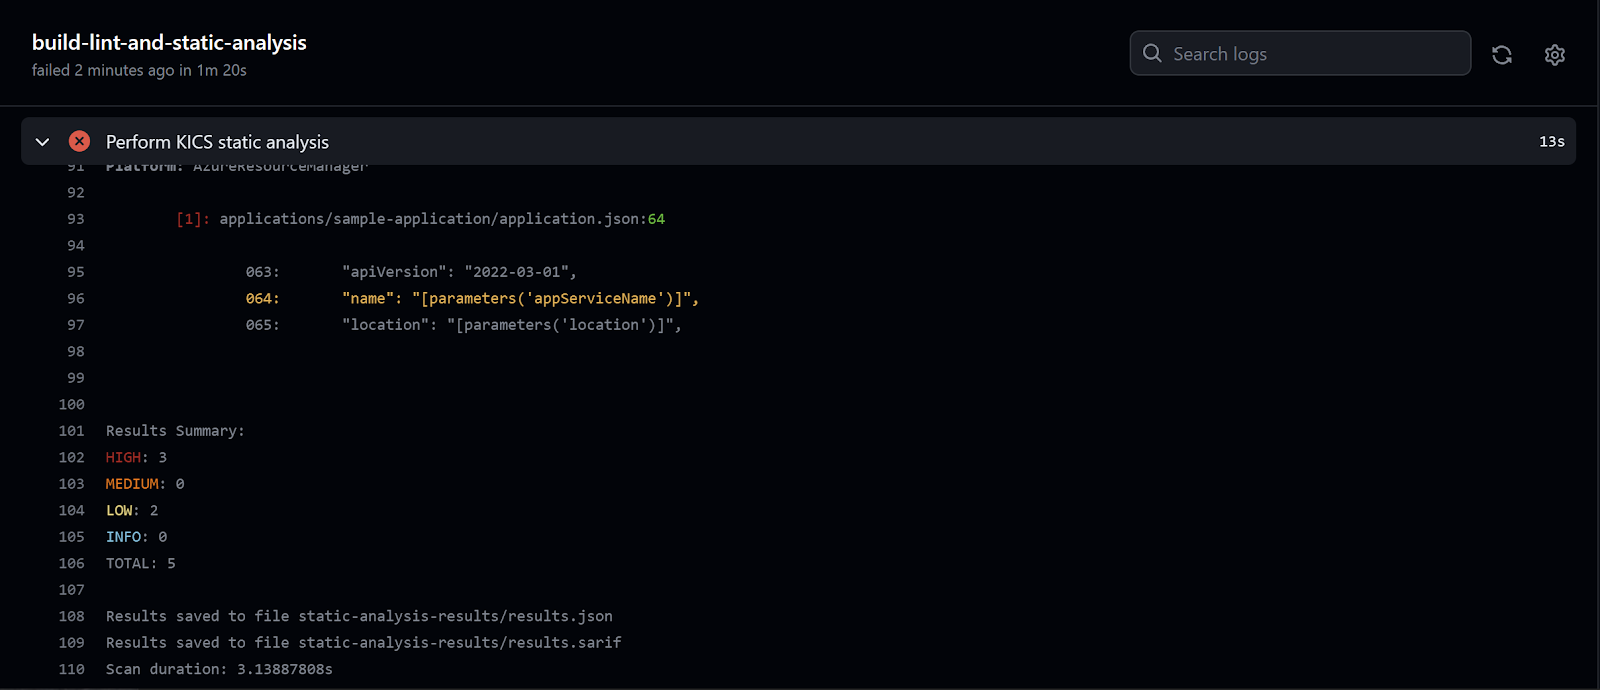
The above analysis step will fail if any issues with severity high or medium are detected. Similarly to the build step, the feedback will be provided through workflow output.
But KICS integration is even more powerful than that. As you may have noticed I've configured output formats from the analysis to be JSON and SARIF. SARIF is a standardized format for sharing static analysis results and it can be used to integrate with the code scanning feature of GitHub Advanced Security. Once again we can use an existing action (this time provided by GitHub) to upload the SARIF file. The only tricky part is to put a proper condition on the upload step so the results are pushed also when the analysis step fails due to the severity of detected issues.
...

jobs:
  build-lint-and-static-analysis:
    runs-on: ubuntu-latest
    permissions:
      actions: read
      contents: read
      security-events: write
    steps:
    ...
    - name: Upload KICS static analysis results
      if: always() && (steps.kics.outcome == 'success' || steps.kics.outcome == 'failure')
      uses: github/codeql-action/upload-sarif@v2
      with:
        sarif_file: 'static-analysis-results/results.sarif'
  ...
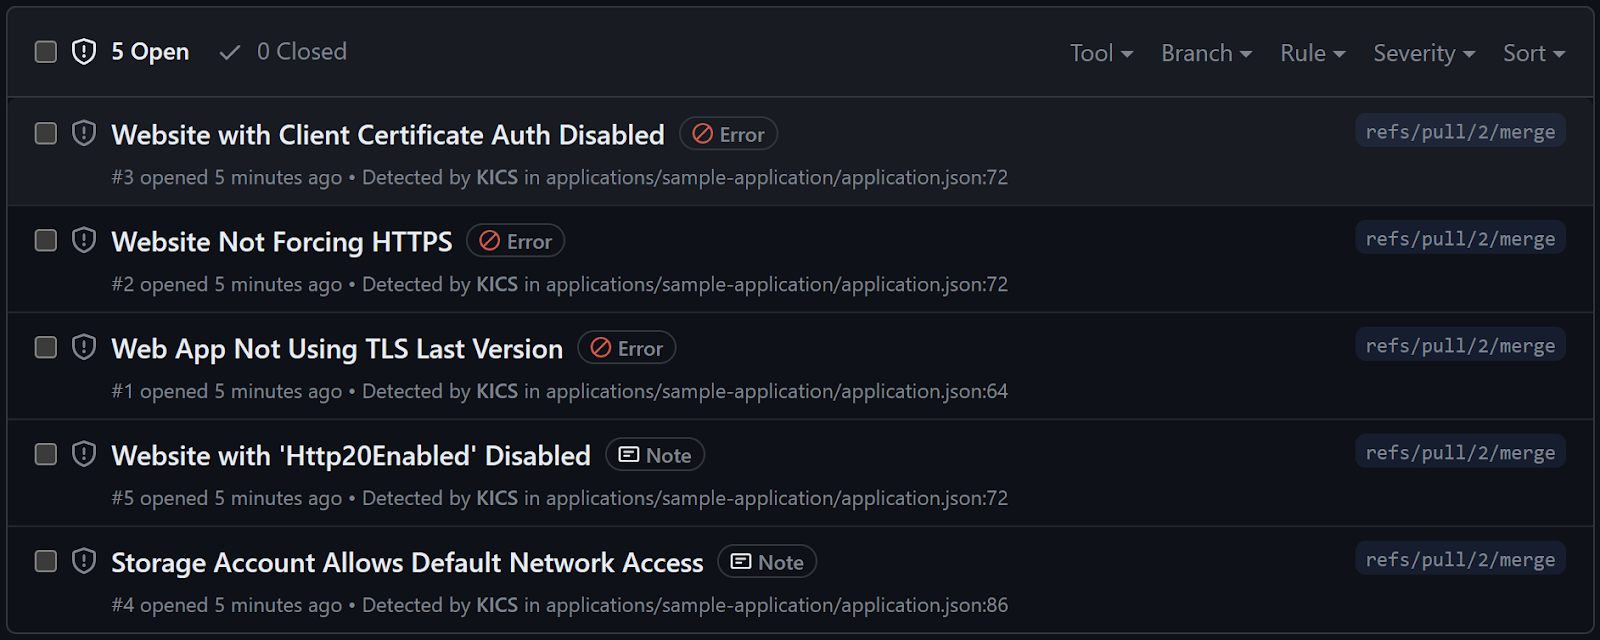
Thanks to this, the issues will be available in the Code Scanning section of the repository Security tab. This will provide alerts for those issues, the ability to triage them, and audit for taken actions.
Now we can say that we have looked at the code enough as part of the integration workflow. In the case of software development, we would probably run now some unit tests. In the case of infrastructure, the equivalent at this stage is testing if the template will deploy successfully.
Preflight Validation for Infrastructure Code
We have verified that the template will build probably and we have removed all important vulnerabilities and misconfigurations. Sadly, this doesn't guarantee that the template will deploy. There may be some policies or conditions on the environment, which are not reflected in any of the checks. To make sure that the template will deploy, we need to perform a preflight validation against the environment. This capability is provided differently by different ecosystems, in the case of Bicep and ARM it comes as Validate deployment mode. This means that we can add another job to our workflow which will establish a connection to Azure and test the deployment.
...

jobs:
  ...
  preflight-validation:
    needs: build-lint-and-static-analysis
    runs-on: ubuntu-latest
    permissions:
      id-token: write
      contents: read
    steps:
    - name: Checkout
      uses: actions/checkout@v3
    - name: Azure Login
      uses: azure/login@v1
      with:
        client-id: ${{ secrets.AZURE_CLIENT_ID }}
        tenant-id: ${{ secrets.AZURE_TENANT_ID }}
        subscription-id: ${{ secrets.AZURE_SUBSCRIPTION_ID }}
    - name: Perform preflight validation
      uses: azure/arm-deploy@v1
      with:
        scope: 'resourcegroup'
        resourceGroupName: 'rg-devops-practices-sample-application-sandbox'
        template: 'applications/sample-application/application.bicep'
        deploymentMode: 'Validate'
        failOnStdErr: false
  ...
This will catch issues like duplicated storage account names (or simple cases where the name is too long) without actually deploying anything.

What's next? Well, there is one common software development practice that we haven't touched yet - pull requests and code reviews. This subject recently caused some heated discussions. There are opinions that if you have an explicit code review step in your process it's not true Continuous Integration. There are also opinions that code reviews are perfectly fine. My opinion is that it's part of team culture. If your team has asynchronous culture, then doing code reviews through pull requests may be the correct way. If your team is collocated or strongly collaborates online, using pair or mob programming instead of code reviews may be the best. We can also detach the discussion around pull requests from the discussion around code reviews. I know teams that are relying on pair programming in place of code reviews but still use pull requests (automatically closed) for tracking purposes. And when we are talking pull requests in the context of infrastructure code, there is one challenge - it's hard to understand the actual change just by looking at code diff (especially after some time). This is why generating a preview of changes as part of the integration workflow can be extremely beneficial.
Preview of Infrastructure Changes
Infrastructure as code tooling usually provides a method to generate a preview - Terraform has the plan, Pulumi has the preview, and Bicep/ARM has the what-if. From the perspective of the integration workflow we are not thinking about running those commands locally but as part of the workflow. And this time we are not interested in results being available as part of the workflow output, we are looking for adding them as more context to the pull request. To be able to do that we first must capture the results. A good method is writing the results to an environment variable.
...

jobs:
  ...
  preview:
    needs: preflight-validation
    runs-on: ubuntu-latest
    permissions:
      id-token: write
      contents: read
    steps:
    - name: Checkout
      uses: actions/checkout@v3
    - name: Azure Login
      uses: azure/login@v1
      with:
        client-id: ${{ secrets.AZURE_CLIENT_ID }}
        tenant-id: ${{ secrets.AZURE_TENANT_ID }}
        subscription-id: ${{ secrets.AZURE_SUBSCRIPTION_ID }}
    - name: Prepare preview
      run: |
        echo 'DEPLOYMENT_WHAT_IF<<EOF' >> $GITHUB_ENV
        az deployment group what-if \
          --resource-group rg-devops-practices-sample-application-sandbox \
          --template-file applications/sample-application/application.bicep \
          --result-format ResourceIdOnly >> $GITHUB_ENV
        echo 'EOF' >> $GITHUB_ENV
  ...
Once we have the results, we can add them to the pull request. My preferred approach is to create a comment. GitHub provides us with script action which allows us to use a pre-authenticated GitHub API client. The issue number and all other necessary information will be available through the context object (if we are using the right trigger).
...

jobs:
  ...
  preview:
    needs: preflight-validation
    runs-on: ubuntu-latest
    permissions:
      id-token: write
      contents: read
      pull-requests: write
    steps:
    ...
    - name:  Create preview comment
      uses: actions/github-script@v6
      with:
        script: |
          github.rest.issues.createComment({
            issue_number: context.issue.number,
            owner: context.repo.owner,
            repo: context.repo.repo,
            body: process.env.DEPLOYMENT_WHAT_IF
          })
  ...
As a result of this job, we will get a nice comment describing in a more human-readable form the changes which deploying the template would cause at this very moment.

We may want even more. Changes are not the only valuable context we may be interested in. The second important information is how deploying the changes will impact the costs.
Cost Estimation of Infrastructure Changes
ThoughtWorks has been recommending run cost as an architecture fitness function since 2019, and there is more than one infrastructure cost estimation tool available to us. The two which are worth mentioning are Infracost (for Terraform) and Azure Cost Estimator (for Bicep/ARM and recently also Terraform). As I'm using Bicep in this article, I'm going to focus on Azure Cost Estimator.
Azure Cost Estimator is still a young tool, yet it's already quite powerful. At the moment of writing this, it supports ~86 resource types. What is very important, it's capable of generating usage base consumption for some resources if you provide usage patterns through metadata in the template. The only tricky part can be integrating it into the workflow. The project repository provides a reusable workflow, but this may not be desired (or even allowed) method in many organizations. This is why I'll walk you through the integration step by step.
The first step is getting the binaries and installing them. If you are using self-hosted runners this can be part of runner setup. You can also download and install the binaries from some central location as part of the workflow itself. Below I'm doing exactly that from the official project releases.
...

jobs:
  ...
  cost-estimation:
    needs: preflight-validation
    runs-on: ubuntu-latest
    steps:
    - name: Checkout
      uses: actions/checkout@v3
    - name: Download Azure Cost Estimator
      id: download-ace
      uses: robinraju/[email protected]
      with:
        repository: "TheCloudTheory/arm-estimator"
        tag: "1.2"
        fileName: "ace-linux-x64.zip"
    - name: Install Azure Cost Estimator
      run: |
        unzip ace-linux-x64.zip
        chmod +x ./azure-cost-estimator
  ...
With the binaries in place, we can use the same pattern as in the case of preview to run the tool, grab the results into an environment variable, and create a comment.
...

jobs:
  ...
  cost-estimation:
    needs: preflight-validation
    runs-on: ubuntu-latest
    permissions:
      id-token: write
      contents: read
      pull-requests: write
    steps:
    ...
    - name: Azure Login
      uses: azure/login@v1
      with:
        client-id: ${{ secrets.AZURE_CLIENT_ID }}
        tenant-id: ${{ secrets.AZURE_TENANT_ID }}
        subscription-id: ${{ secrets.AZURE_SUBSCRIPTION_ID }}
    - name: Prepare cost estimation
      run: |
        echo 'COST_ESTIMATION<<EOF' >> $GITHUB_ENV
        azure-cost-estimator applications/sample-application/application.bicep \
          ${{ secrets.AZURE_SUBSCRIPTION_ID } \
          rg-devops-practices-sample-application-sandbox \
          --stdout --disableDetailedMetrics >> $GITHUB_ENV
        echo 'EOF' >> $GITHUB_ENV
    - name:  Create pull request comment
      uses: actions/github-script@v6
      with:
        script: |
          github.rest.issues.createComment({
            issue_number: context.issue.number,
            owner: context.repo.owner,
            repo: context.repo.repo,
            body: process.env.COST_ESTIMATION
          })
  ...
This will give us a lot of additional, valuable context in the pull request.

The Beginning of the Implementation Journey
This post describes just the beginning of the DevOps practices implementation journey.

It gives a hint about the entire technology ecosystem, but the remaining practices have many interesting aspects to dive into. I do intend to continue walking through them with proposed implementations, just to make your journey easier. I've also created a repository that contains samples with different parts of implementation (available in different branches with results in different closed pull requests). You can review it to find all the relevant information. You can also create a fork and have your own playground.