
Feeding Server Timing API from ASP.NET Core
There is a number of Web APIs which allow measuring performance of web applications:
- User Timing API (access to high precision timestamps)
- Resource Timing API (timing information related to resources on a document)
- Navigation Timing API (timing information related to navigation and elements)
The youngest member of the family is Server Timing API which allows communicating the server performance metrics to the client. The API is not widely supported yet, but the Chrome Devtools is able to interpret the information send from the server and expose it as part of request timing information. Let's see how this feature can be utilized from ASP.NET Core.
Basics of Server Timing API
The Server Timing definition of metric can be represented by following structure.
public struct ServerTimingMetric
{
    private string _serverTimingMetric;

    public string Name { get; }

    public decimal? Value { get; }

    public string Description { get; }

    public ServerTimingMetric(string name, decimal? value, string description)
    {
        if (String.IsNullOrEmpty(name))
            throw new ArgumentNullException(nameof(name));

        Name = name;
        Value = value;
        Description = description;

        _serverTimingMetric = null;
    }

    public override string ToString()
    {
        if (_serverTimingMetric == null)
        {
            _serverTimingMetric = Name;

            if (Value.HasValue)
                _serverTimingMetric = _serverTimingMetric + "=" + Value.Value.ToString(CultureInfo.InvariantCulture);

            if (!String.IsNullOrEmpty(Description))
                _serverTimingMetric = _serverTimingMetric + ";\"" + Description + "\"";
        }

        return _serverTimingMetric;
    }
}
The only required property is name, which means that metric can be used for indication that something has happened without any related duration information.
The metrics are delivered to the client through Server-Timing response header. The header may occur multiple times in the response, which means that multiple metrics can be delivered through multiple headers or as single comma-separated list (or combination of both). A class representing the header value could look like below.
public class ServerTimingHeaderValue
{
    public ICollection<ServerTimingMetric> Metrics { get; }

    public ServerTimingHeaderValue()
    {
        Metrics = new List<ServerTimingMetric>();
    }

    public override string ToString()
    {
        return String.Join(",", Metrics);
    }
}
Knowing how to construct the header we can try to feed the Chrome Devtools with some information. First we can write an extension method which will simplify adding header to the response.
public static class HttpResponseHeadersExtensions
{
    public static void SetServerTiming(this HttpResponse response, params ServerTimingMetric[] metrics)
    {
        ServerTimingHeaderValue serverTiming = new ServerTimingHeaderValue();

        foreach (ServerTimingMetric metric in metrics)
        {
            serverTiming.Metrics.Add(metric);
        }

        response.Headers.Append("Server-Timing", serverTiming.ToString());
    }
}
Now we can create an empty web application and use the extension method for setting some metrics.
public class Startup
{
    ...

    public void Configure(IApplicationBuilder app)
    {
        ...

        app.Run(async (context) =>
        {
            context.Response.SetServerTiming(
                new ServerTimingMetric("cache", 300, "Cache"),
                new ServerTimingMetric("sql", 900, "Sql Server"),
                new ServerTimingMetric("fs", 600, "FileSystem"),
                new ServerTimingMetric("cpu", 1230, "Total CPU")
            );

            await context.Response.WriteAsync("-- Demo.AspNetCore.ServerTiming --");
        });
    }
}
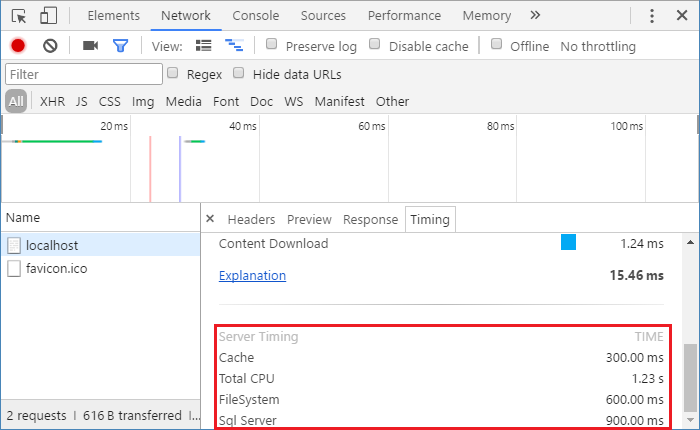
After hitting F5 and navigating to the demo application in Chrome the metrics should be visible in the Chrome Devtools.
Making it more usable
The above demo shows that Server Timing API works, but from developer perspective we would want an easy way for providing metrics from different places in the application. In case of ASP.NET Core it usually means middleware and service.
The service can be quite simple, it just needs to expose the collection of metrics
public interface IServerTiming
{
    ICollection<ServerTimingMetric> Metrics { get; }
}

internal class ServerTiming : IServerTiming
{
    public ICollection<ServerTimingMetric> Metrics { get; }

    public ServerTiming()
    {
        Metrics = new List<ServerTimingMetric>();
    }
}
The important part is that metrics needs to be collected per request. This can be achieved by properly scoping the service at registration.
public static class ServerTimingServiceCollectionExtensions
{
    public static IServiceCollection AddServerTiming(this IServiceCollection services)
    {
        services.AddScoped<IServerTiming, ServerTiming>();

        return services;
    }
}
The missing part is the middleware which will set the Server-Timing header with the metrics gathered by the service. The tricky part is that the header value should be set as late as possible (so there is a chance for other components in pipeline to provide metrics). Setting the header value before invoking next step in pipeline would be usually to early while trying to do so after that might result in error as headers could have already been sent to client. The solution to this challenge is HttpResponse.OnStarting method which allows adding a delegate which will be invoked just before sending the response headers.
public class ServerTimingMiddleware
{
    private readonly RequestDelegate _next;

    private static Task _completedTask = Task.FromResult<object>(null);

    public ServerTimingMiddleware(RequestDelegate next)
    {
        _next = next ?? throw new ArgumentNullException(nameof(next));
    }

    public Task Invoke(HttpContext context)
    {
        HandleServerTiming(context);

        return _next(context);
    }

    private void HandleServerTiming(HttpContext context)
    {
        context.Response.OnStarting(() => {
            IServerTiming serverTiming = context.RequestServices.GetRequiredService<IServerTiming>();

            if (serverTiming.Metrics.Count > 0)
            {
                context.Response.SetServerTiming(serverTiming.Metrics.ToArray());
            }

            return _completedTask;
        });
    }
}
Below is the same demo as previously but based on middleware and service. The result is exactly the same, but now the service is accessible through DI which allows for easy gathering of metrics.
public class Startup
{
    public void ConfigureServices(IServiceCollection services)
    {
        services.AddServerTiming();
    }

    public void Configure(IApplicationBuilder app)
    {
        ...

        app.UseServerTiming()
            .Run(async (context) =>
            {
                IServerTiming serverTiming = context.RequestServices
                    .GetRequiredService<IServerTiming>();

                serverTiming.Metrics.Add(new ServerTimingMetric("cache", 300, "Cache"));
                serverTiming.Metrics.Add(new ServerTimingMetric("sql", 900, "Sql Server"));
                serverTiming.Metrics.Add(new ServerTimingMetric("fs", 600, "FileSystem"));
                serverTiming.Metrics.Add(new ServerTimingMetric("cpu", 1230, "Total CPU"));

                await context.Response.WriteAsync("-- Demo.AspNetCore.ServerTiming --");
            });
    }
}
It is important to remember that it is the server who is in full control of which metrics are communicated to the client and when, which may mean that the middleware (or metrics gathering) should be used conditionally.
I've made all the mentioned here classes (and some more) available on GitHub and NuGet ready to use.